雅思写作小作文范文 雅思写作折线图(线状图) 世界食物与石油价格
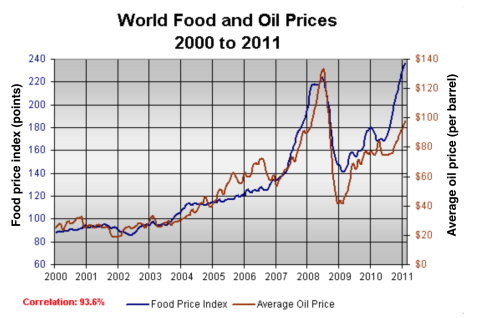
今天我们雅思写作小作文范文的文章来研究下折线图(线状图)。该图表给出的信息为2000年到2011年间全球食物和石油价格的变化。可以看出两者的走势具有很强的相似性。同时,其变化可以明确的分为四个阶段:基本稳定,持续上升,突然下跌,再次上升等。老烤鸭小编搜集了一篇相应的考官范文,以供大家参考。
雅思写作小作文题目
The graph below shows changes in global food and oil prices between 2000 and 2011.
Summarise the information by selecting and reporting the main features, and make comparisons where relevant.

雅思写作小作文范文
The line graph compares the average price of a barrel of oil with the food price index over a period of 11 years.
该折线图比较了从2000年到2011年这11年的时间里每桶石油的平均价格以及相应的食物价格指数。
It is clear that the average global prices of both oil and food rose considerably between 2000 and 2011. Furthermore, the trends for both commodities were very similar, and so a strong correlation (93.6%) is suggested.
很明显,无论是全球石油价格还是食物价格在2000年到2011年间都有显著上升。此外,两种商品价格的变化趋势十分相似,并具有很强的相关性(93.6%)。
In the year 2000, the average global oil price was close to $25 per barrel, and the food price index stood at just under 90 points. Over the following four years, both prices remained relatively stable, before rising steadily between 2004 and 2007. By 2007, the average oil price had more than doubled, to nearly $60 per barrel, and food prices had risen by around 50 points.
在2000年,全球石油平均价格接近25美元一桶。而食物价格指数还不到90点。在接下来的四年里,两种商品的价格都保持相对稳定,但随后在2004年到2007年间持续上升。到2007年,石油的平均价格翻了一倍多,达到将近60美元一桶,而食物价格则上升了大约50个点。
A dramatic increase in both commodity prices was seen from 2007 to 2008, with oil prices reaching a peak of approximately $130 per barrel and the food price index rising to 220 points. However, by the beginning of 2009, the price of oil had dropped by roughly $90, and the food price index was down by about 80 points. Finally, in 2011, the average oil price rose once again, to nearly $100 per barrel, while the food price index reached its peak, at almost 240 points.
从2007年到2008年,两种商品的价格都急剧上升。石油价格达到大约每桶130美元的顶点,而食物价格则上升到了220点。然而,到2009年开始的时候石油价格下降了大约90美元,同时食物价格指数下降了大约80个点。最终,在2011年,石油平均价格再次上升,达到将近一桶100美元,而食物价格则达到顶点,大约240点左右。


