雅思写作小作文范文 雅思写作饼状图pie chart 电力来源
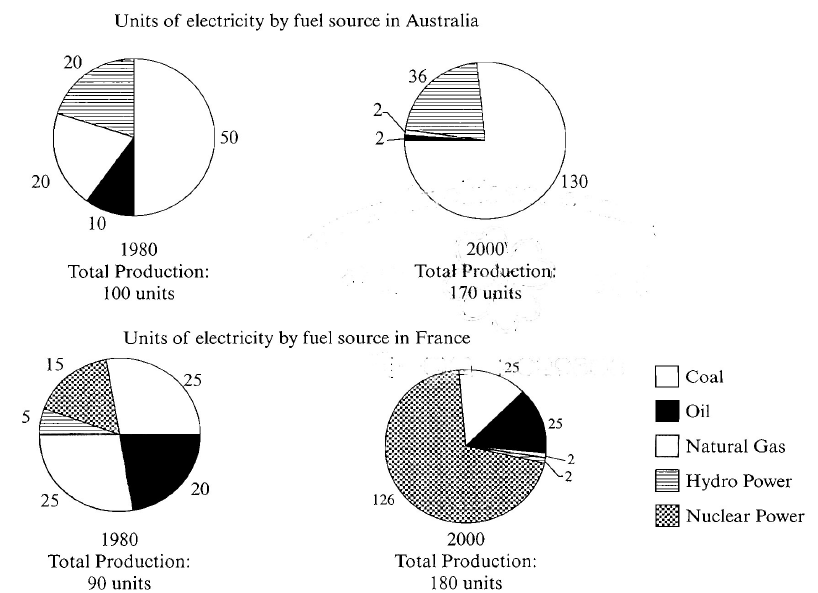
今天我们雅思写作小作文范文的文章来研究下饼状图pie chart。该图表展示了1980年和2000年,澳大利亚和法国在发电过程中使用的不同燃料的状况。具体燃料类型有:煤,石油,天然气,水能和核能。需要注意的是,该饼状图中的数字并不表示百分比,而是赋予了具体的数字。老烤鸭小编搜集了一篇相关的考官范文,以供大家参考。
雅思写作小作文题目
The pie charts below show units of electricity production by fuel source in Australia and France in 1980 and 2000.
Summarise the information by selecting and reporting the main features, and make comparisons where relevant.

雅思写作小作文范文
The pie charts compare the amount of electricity produced using five different sources of fuel in two countries over two separate years.
该饼状图比较了两个国家在不同的年份使用五种不同燃料来源所产生的电能数量。
Total electricity production increased dramatically from 1980 to 2000 in both Australia and France. While the totals for both countries were similar, there were big differences in the fuel sources used.
从1980年到2000年,澳大利亚和法国的电能总产量都急剧上升。虽然两个国家的总量比较相似,但在其所使用的燃料上存在巨大差异。
Coal was used to produce 50 of the total 100 units of electricity in Australia in 1980, rising to 130 out of 170 units in 2000. By contrast, nuclear power became the most important fuel source in France in 2000, producing almost 75% of the country’s electricity.
1980年,澳大利亚总计100单位的电力中,用煤发电占到其中的50单位。这一数字在2000年上升到130单位(总量为170单位)。相比之下,核能在2000年的法国成为最主要的燃料来源,产生整个国家电力的百分之75左右。
Australia depended on hydro power for just under 25% of its electricity in both years, but the amount of electricity produced using this type of power fell from 5 to only 2 units in France. Oil, on the other hand, remained a relatively important fuel source in France, but its use declined in Australia. Both countries relied on natural gas for electricity production significantly more in 1980 than in 2000.
在这两年中,澳大利亚的水力发电量不到总发电量的百分之25。但法国使用该能源产生的电力数量从5单位降到了2单位。另一方面,石油仍然是法国电力的重要来源之一,但其使用量在澳大利亚有所下降。两个国家在1980年利用天然气发电的数量都明显比2000年要多。
点击查看雅思写作小作文高分范文,快速提升写作成绩


