雅思写作小作文范文 雅思写作饼状图pie chart 学校花费
今天我们雅思写作小作文范文的文章来研究下饼状图pie chart。跟以前咱们见过的题目不同,这次有三个图形。如此一来,数据就显得非常多和杂乱,十分考验大家挑选关键信息并进行比较的能力。老烤鸭小编搜集了一篇相应的考官范文,以供大家参考。
雅思写作小作文题目
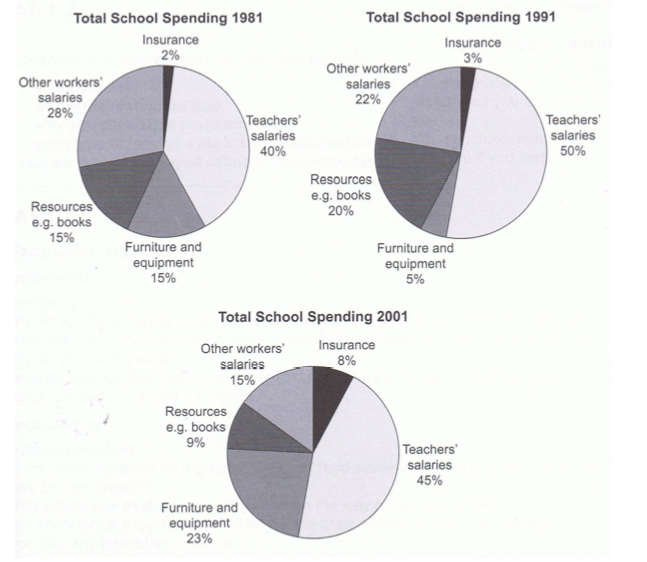
The three pie charts below show the changes in annual spending by a particular UK school in 1981, 1991 and 2001.
Summarise the information by selecting and reporting the main features, and make comparisons where relevant.

雅思写作小作文范文
The pie charts compare the expenditure of a school in the UK in three different years over a 20-year period.
饼状图比较了一所英国学校在20年的时间跨度中三年的花费。
It is clear that teachers’ salaries made up the largest proportion of the school’s spending in all three years (1981, 1991 and 2001). By contrast, insurance was the smallest cost each year.
很明显,教师的工资在所有三个年份(1981年,1991年和2001年)中占据学校花费的最大部分。相比之下,保险在每一年里都是最小的花费。
In 1981, 40% of the school’s budget went on teachers’ salaries. This figure rose to 50% in 1991, but fell again by 5% in 2001. The proportion of spending on other workers’ wages fell steadily over the 20-year period, from 28% of the budget in 1981 to only 15% in 2001.
1981年,学校预算的百分之四十用于教师的薪酬纸上。这一数字在1991年上升到百分之五十,但在2001年又下降了百分之五。工人工资的比例在二十年中稳定下降,从1981年预算的百分之二十八到2001年预算的百分之十五。
Expenditure on insurance stood at only 2% of the total in 1981, but reached 8% in 2001. Finally, the percentages for resources and furniture/equipment fluctuated. The figure for resources was highest in 1991, at 20%, and the proportion of spending on furniture and equipment reached its peak in 2001, at 23%.
1981年,保险的花费占到整体花费的百分之二。但在2001年上升到百分之八。最终,资源、家具和设备所占比例起伏不定。代表资源的数字在1991年最高,达到百分之二十,而家具和设备花费的比例在2001年达到顶峰,占百分之二十三。
点击查看雅思写作小作文高分范文,快速提升写作成绩


