城市人口比例-雅思写作柱状图bar chart-雅思小作文范文 population living in urban areas
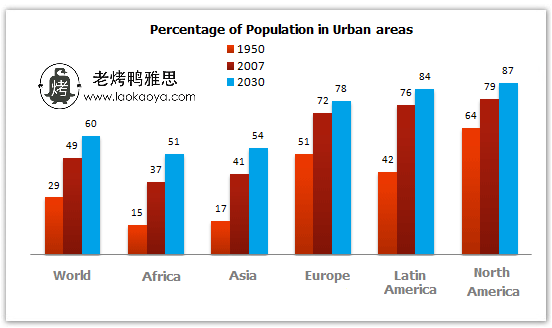
这篇雅思写作小作文要求大家描述1950年,2007年和预计2030年世界各地城市人口的比例。从图表中我们可以看出,全世界的城市人口比例都有显著增长,其中非洲的增幅最大,而北美洲的城市人口比例一直最高。老烤鸭小编搜集了一篇相关的高分范文,以供大家参考。
雅思写作小作文题目
The bar chart below gives information about the percentage of the population living in urban areas in the world and in different continents.
Summarise the information by selecting and reporting the main features, and make comparisons where relevant.

雅思写作小作文范文
The column graph gives data on the growth of urban population in five different continents as well as in the world as a whole in three different years including the projection for the year 2030. Overall, percentages of global city-dwellers increased remarkably and a great ratio of the world population will live in cities in the future.
柱状图提供了五个不同大洲以及整个世界在三个不同年份中的城市人口增长数据,其中包括对2030年的预测。总体而言,全球城市居民比例显着增加,将来世界上很大一部分人口将居住在城市中。
As is obvious from the illustration, less than one-third global population lived in urban areas in 1950. The majority of this city-dwellers were in American and European continents while only 15-17% Asian and African were in municipalities. After 57 years, around half of the global population lived in cities and in Europe and America, this ratio went as high as eight out of ten. More than one-third African lived in urban areas in this year while it was slightly over 40% in Asia.
从图表中可以明显看出,1950年,全球不到三分之一的人口居住在城市地区。这些城市居民大多数位于美洲和欧洲大陆,而只有15-17%的亚洲和非洲人居住在城市。57年后,大约一半的全球人口居住在城市之中。在欧美这一比例高达十分之八。这一年里,超过三分之一的非洲人居住在城市地区,而亚洲的这一比例略高于40%。
It is projected that six out of ten persons in the world will live in urban areas in 2030. In this year more than 8 persons in every ten in America would be city living population while almost the same ratio would prevail for the European city-dwellers. In Africa and Asia, more than half of the population will start living in different cities.
预计到2030年,全球十分之六的人口将居住在城市地区。那时候美国十分之八的人口将是城市居民,而欧洲城市居民的比例几乎相同。在非洲和亚洲,一半以上的人口将开始住在不同的城市。
点击查看更多雅思写作小作文高分范文,快速提升写作成绩


