英国老年人口-雅思写作柱状图bar chart-雅思小作文范文 UK’s ageing population
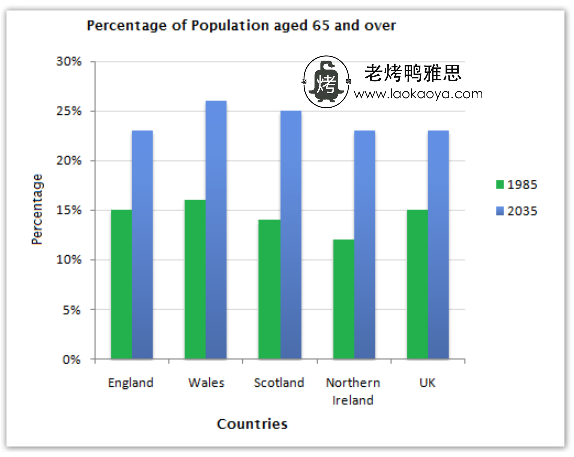
这篇雅思写作小作文要求大家描述1985年和2035年英国几个地区与整体的老年人口比例。从图中我们可以看出,在这两年里,威尔士的老年人口比例均为最高,而北爱尔兰的老年人口比例增长最大。老烤鸭小编搜集了一篇相关的高分范文,以供大家参考。
雅思写作小作文题目
The chart below gives information about the UK’s ageing population in 1985 and makes predictions for 2035.
Summarise the information by selecting and reporting the main features, and make comparisons where relevant.

雅思写作小作文范文
The given bar graph gives data on the old population of the United Kingdom for the year 1985 and also gives the projection for the year 2035.
柱状图给出了1985年英国的老年人口数据,并给出了2035年的预测。
As is observed from the given data, there were around 10% to 15% aged people who were more than 65 years old in 1985 in England, Wales, Scotland, Northern Ireland and the UK. Among these countries that form the United Kingdom, the highest percentage of those aged people were in Wales amounting about 16% and the lowest percentage was in Northern Ireland which was about 12%.
从给定的数据中可以看出,1985年威尔士,苏格兰,北爱尔兰和英国超过65岁的老年人口比例大约在10%到15%之间。在构成英国的这些国家中,老年人口比例最高的是威尔士,约为16%,而最低的比例是北爱尔兰,约为12%。
The bar graph also shows the projection of the aged people in those countries and according to the projection, there would be a mentionable increase in the percentage of those aged people in 2035. The population over 65 years old would be around 25% and that represents the improvement of the lifespan of people in these countries. Wales would have the highest percentage of aged people in the given countries which would be around 27%.
柱状图还显示了这些国家老年人口的预测。根据预测,到2035年,老年人口百分比将有显着增加。65岁以上的人口将达到25%左右。这代表着这些国家人均寿命的延长。在给出的国家中,威尔士的老年人比例最高,约为27%。
点击查看更多雅思写作小作文高分范文,快速提升写作成绩


