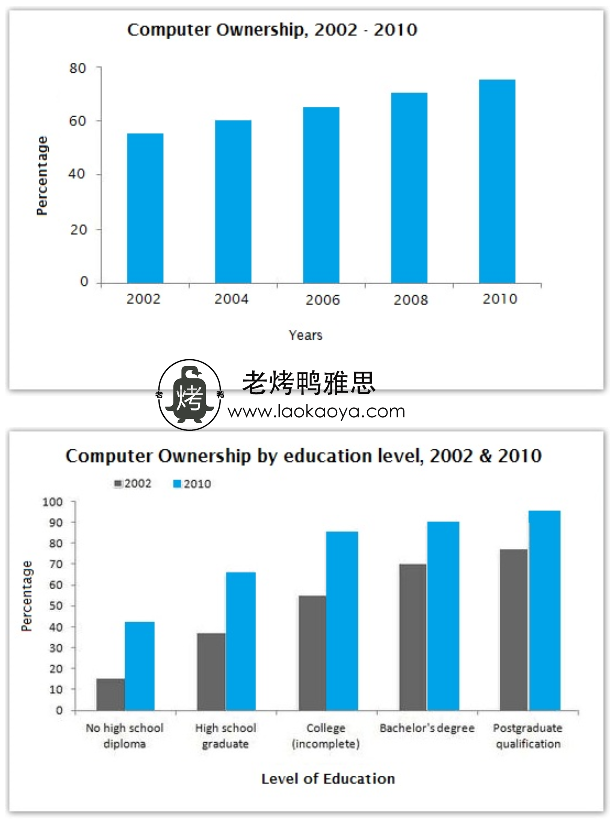
计算机拥有率与教育水平-雅思写作柱状图bar chart-雅思小作文范文 Computer ownership and level of education
这篇雅思写作小作文要求我们描述某个国家2002年至2010年间计算机拥有率的变化,以及2002年和2010年这两年里不同学历人群中计算机拥有率的差异。从图中我们可以看出,计算机拥有率随着年份的推移和学历的升高而增加。老烤鸭小编搜集了一篇相关的高分范文,以供大家参考。
雅思写作小作文题目
The graphs below give information about computer ownership as a percentage of the population between 2002 and 2010, and by the level of education for the years 2002 and 2010.
Summarise the information by selecting and reporting the main features, and make comparisons where relevant.

雅思写作小作文范文
The given bar graphs show data on the percentage of computer ownership from the year 2002 to 2010 both by comparison of total population and education level. As is observed from the given graphs, the computer ownership increased over the years and this ownership among the people with higher studies was higher than others.
给定的柱状图通过比较总人口和受教育程度显示了2002年到2010年之间计算机拥有率的数据。从给定的图表可以看出,多年来计算机的拥有量有所增加,而且受过较高教育的人中,计算机拥有量高于其他人。
According to the first graph, more than 50% of people owned computers in 2002 and this percentage kept on increasing over years. After 6 years this percentage reached over 60% and finally in 2010 the percentage of people who owned computers reached over 70%.
根据第一个图表,2002年超过50%的人拥有计算机,并且这一比例一直在增长。六年后,这一比例达到了60%以上,最终在2010年,拥有计算机的比例达到了70%以上。
From the second bar graph, we can observe that the percentage of computer ownership increased with the education level; i.e. the higher the education level the higher the percentage of computer ownership. For instance, 15% of the people who had High school graduation owned computers in 2002 and this percentage were about 60 per cent for Bachelor degree holders and over 80 per cent for the postgraduate degree holders. After 8 years, in 2010, the same trend could be observed and the percentage of people who owned computers increased significantly compared to 2002.
从第二个柱状图中,我们可以看到计算机拥有率随着受教育程度的增加而增加;即,受教育程度越高,计算机拥有率越高。例如,2002年拥有高中毕业的人中有15%拥有计算机,学士学位持有者的比例约为60%,而对于研究生学位持有者而言则超过80%。8年后的2010年,可以观察到相同的趋势,拥有计算机的百分比与2002年相比有了显着增长。
点击查看更多雅思写作小作文高分范文,快速提升写作成绩


