2008年食物消耗量-雅思写作饼状图pie chart-雅思小作文范文 average consumption of food
这篇雅思写作小作文要求大家描述2008年中国、印度以及整个世界的四种食物(加工食物,蔬菜与水果,动物食物,坚果与种子)平均消耗量。因为数据项目较少,图表对比也还算清晰,写作难度不算太大。老烤鸭小编搜集了一篇高分范文,以供大家参考。
雅思写作小作文题目
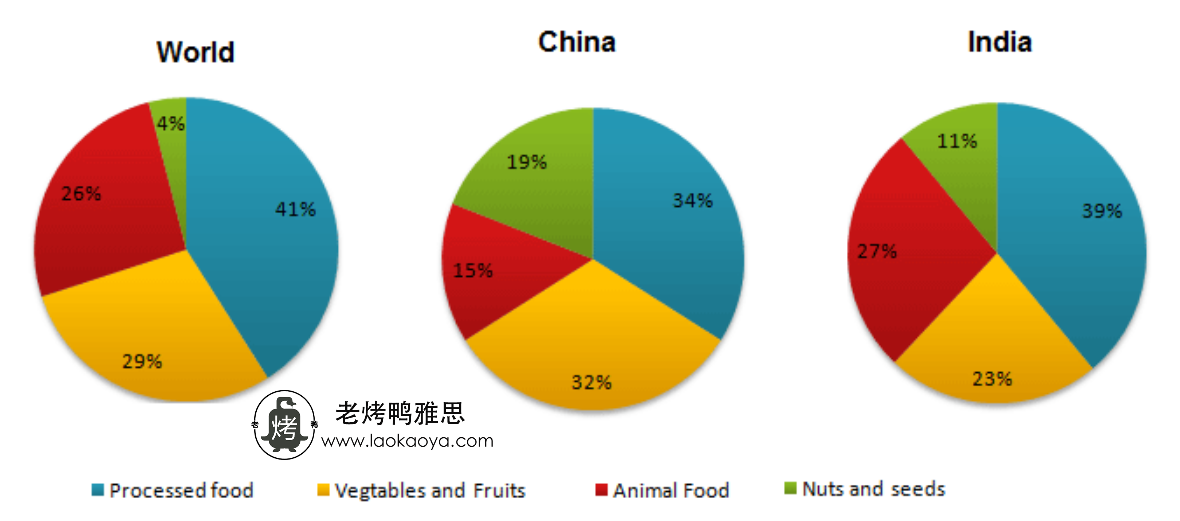
The pie charts show the average consumption of food in the world in 2008 compared to two countries; China and India.
Summarise the information by selecting and reporting the main features, and make comparisons where relevant.

雅思写作小作文范文
The pie charts outline the types of food people ate in 2008 compared with the consumption of these items in China and India in the same year. As a general trend, processed food was the main energy source for the world population and consumption of nuts and seeds in China and India was significantly higher than the world average.
饼状图概述了2008年人们食用的食物类型,以及当年中国和印度消费这些食物的数量。总体而言,加工食品是世界人口的主要能量来源,中国与印度的坚果和种子消费量大大高于世界平均水平。
As the illustration suggests, just over 40% diet of the global population came from processed food in 2008 which was slightly greater than that of India and exactly 7% higher than that of China. Vegetables and fruits provided somewhat one-third dietary requirements of the Chinese citizens and precisely 23% of Indians. The world average for fruit and vegetable consumption was just below 30%.
如图所示,2008年,全球人口饮食中有40%多一点来自加工食品,略高于印度,同时比中国高7%。蔬菜和水果约占中国公民饮食需求的三分之一,占到印度人的23%。世界水果和蔬菜消费量的平均值略低于30%。
Interestingly, nuts and seeds accounted for almost one-fifth food stocks for the Chinese, a noticeably higher rate than the world standard. Nearly one-tenth food rations in India was from nuts and seeds. Food derived from animals supplied more than one-fourth Indian dietary provisions, which was 12% higher than that of China and almost the same of the world’s dietary demands.
有趣的是,坚果和种子几乎占中国人粮食储备的五分之一,明显高于世界水平。印度几乎有十分之一的口粮来自坚果和种子。来自动物的食物提供了印度四分之一以上的饮食供给,比中国高出12%,几乎与世界的饮食需求相同。
点击查看更多雅思写作小作文高分范文,快速提升写作成绩


