英国人消费习惯-雅思写作饼状图pie chart-雅思小作文范文 spending habits of people in the UK
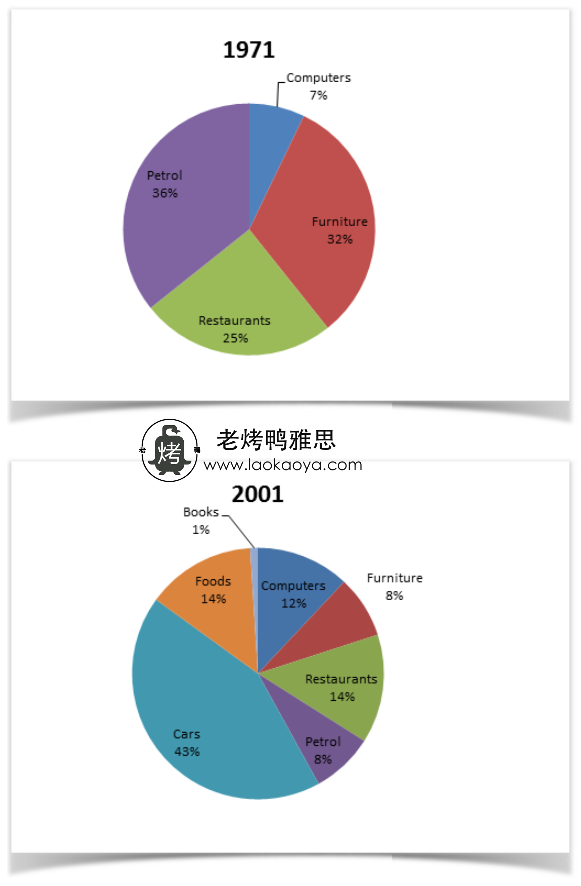
这篇雅思写作小作文要求大家描述从1971年到2001年这30年的时间里英国居民消费习惯的变化。从图表中我们可以看出,2001年的消费品类明显增多,汽车消费从原来的没有数据一跃而成比例最大的存在。老烤鸭小编搜集了一篇相关的高分范文,以供大家参考。
雅思写作小作文题目
The graphs show changes in spending habits of people in the UK between 1971 and 2001.
Summarise the information by selecting and reporting the main features, and make comparisons where relevant.

雅思写作小作文范文
The pie charts illustrate the changes in household spending in the UK between 1971 and 2001. It is clear that the cost of petrol made up the largest proportion of household spending in 1971 while expenditure on cars was the greatest share of household spending in 2001.
饼状图说明了1971年至2001年英国家庭支出的变化。很明显,汽油花费在1971年占家庭支出的比重最大,而汽车支出则占2001年英国家庭支出的最大份额。
British spent more than one-third of their money on petrol and almost a third to purchase furniture followed by money spent in restaurants, which was precisely a quarter. The least proportion of expenditure was for computers, which accounted for 7% of total expenses by Brits in 1971.
英国人将超过三分之一的钱花在汽油上,将近三分之一花在购买家具上。在餐厅上花的钱紧跟其后,占到整整四分之一。支出的比例最小的是计算机,占1971年英国人总支出的7%。
After 30 years, British citizens spent significantly less portion to buy petrol, furniture and restaurant meals – 8%, 8%, and 14% respectively. In comparison to 1971, they spent nearly double on computers. The largest proportion of household spending was made on owing cars with more than 40% total expenses. The proportion of expenditure on food was 14%. Finally, for books, it was considerably small, only one per cent of total costs in 2001.
30年后,英国公民用于购买汽油,家具和外出就餐的花费明显减少,分别为8%,8%和14%。与1971年相比,他们在计算机上的花费几乎翻了一番。家庭支出的最大比例用于购置汽车,超过总支出的40%。食品支出的比例为14%。最后,对于书籍来说,支出很少,仅占2001年总费用的百分之一。
点击查看更多雅思写作小作文高分范文,快速提升写作成绩


