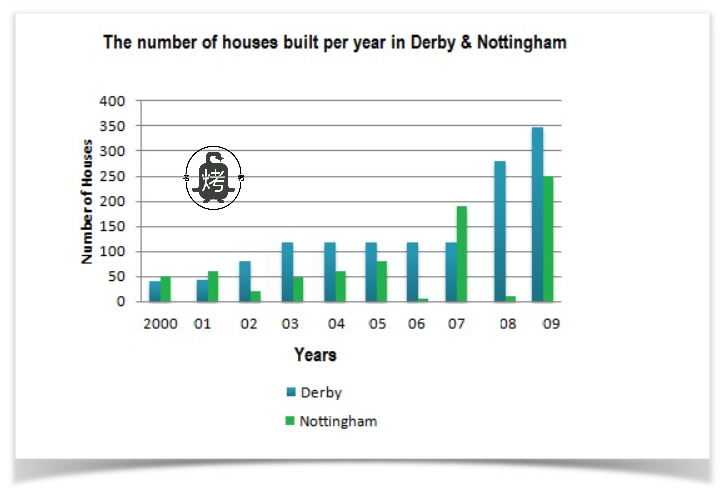
每年建造的房屋数量-雅思写作柱状图bar chart-雅思小作文范文 the number of houses built per year
这篇雅思写作小作文要求大家描述2000年至2009年之间,德比和诺丁汉两地每年修建的房屋数量。从图表中我们可以看出,虽然中间有不小的波动,但整体上看,两者的数据都呈现出明显的上升趋势。针对这道题目,老烤鸭小编搜集了一篇相关的高分范文,以供大家参考。
雅思写作小作文题目
The diagram below shows the number of houses built per year in two cities, Derby and Nottingham, Between 2000 and 2009.
Summarise the information by selecting and report in the main features, and make comparisons where relevant.

雅思写作小作文范文
The bar chart compares the construction of new houses in two cities – Derby and Nottingham, from 2000 to 2009. Generally speaking, the number of new homes in these two cities increased steadily through the years and inhabitants of Derby end up building more abodes in the final year despite a considerable gap in the previous year.
柱状图比较了2000年至2009年两个城市(德比和诺丁汉)的新房屋建设情况。总体而言,这两个城市中的新房屋的数量多年来一直稳定增长,德比居民在最后一年建造房屋数量较多,尽管它与前一年有很大的差距。
As the data suggest, around 95 residences were built in these two cities in 2000 and 50 of them were established in Nottingham. In 2002, roughly 70 further houses came into existence in Derby which was considerably higher than the development of new abodes in Nottingham. This trend continued until 2005.
数据表明,2000年这两个城市建造了大约95座住宅,其中有50座在诺丁汉。2002年,德比建造了大约70所房屋,这大大超过了诺丁汉新居的发展。这种趋势一直持续到2005年。
Next year, almost no new houses were built in Nottingham but Derby witnessed the creation of almost 110 new homes. In 2007, a reverse case was obvious when around 190 brand new buildings were made in Nottingham compared to just over 100 in Derby. Building new homes in 2008 showed another anomaly when an ignorable number of new homes were developed in Nottingham against nearly 280 brand new houses in Derby.
下一年中,诺丁汉几乎没有建造新房屋,但德比却见证了近110座新房屋的建造。2007年,情况有了逆转,诺丁汉建造了大约190座全新建筑,而德比制造了一百多座。2008年的新房屋建造又出现了异常现象。当在诺丁汉开发的新房数量几乎可以被忽略时,德比却有近280套全新房屋出现。
In the final year, 250 new dwellings were added to Nottingham city while almost 350 were developed for Derby residents.
在最后一年里,诺丁汉市增加了250套新住宅,而有近350套新住宅为德比居民开发。
点击查看更多雅思写作小作文高分范文,快速提升写作成绩


