不同交通方式的二氧化碳排放和资金-雅思写作混合图-雅思小作文范文
这篇雅思写作小作文介绍了欧盟地区各种交通方式的二氧化碳排放量,以及欧盟在这些交通方式上所花费的资金。第一张柱状图比较简单,但第二张饼状图中却出现了大量只占1%的项目,处理起来稍显麻烦。老烤鸭小编收集了一篇相关的高分范文,以供大家参考。
雅思写作小作文题目
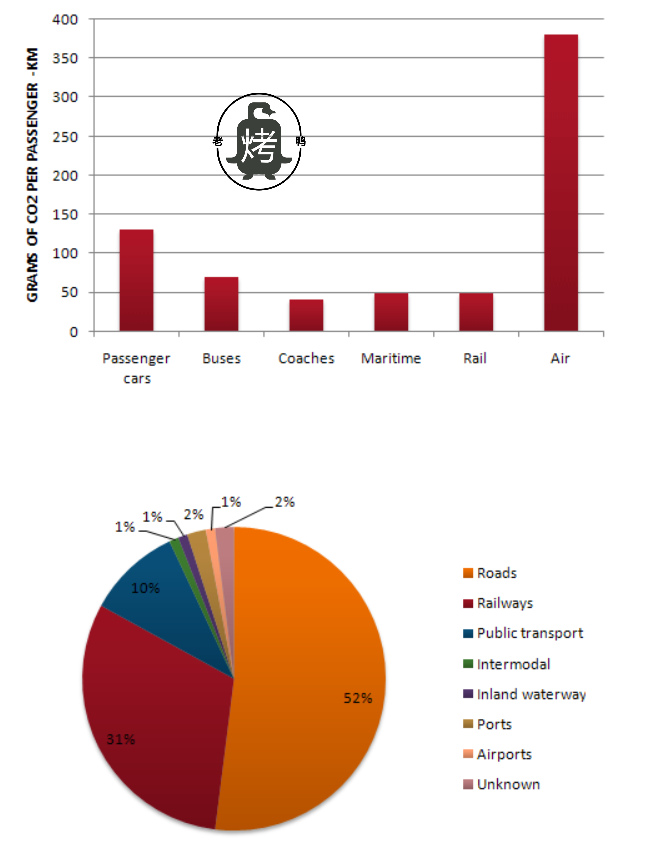
The graph below shows CO2 emissions for different forms of transport in the European Union. The Pie Chart shows the percentage of European Union funds being spent on different forms of transport.
Summarise the information by selecting and reporting the main features, and make comparisons where relevant.

雅思写作小作文范文
The graphs outline the amount of Carbon dioxide emission per passenger from different vehicles in the European Union and the EU expenditures on different modes of transportation. Overall, the highest amount of CO2 per person is emitted by the Air transports and the European Union spends the highest percentage of funds for the road transportation system.
这些图表展示了欧盟不同车辆上每位乘客的二氧化碳排放量以及欧盟在不同交通方式上的支出。总体而言,航空运输每人排放的二氧化碳量最高,而欧盟在道路运输系统上的支出比例最高。
According to the bar graph, a single passenger of a personal car is responsible for around 130 gm of CO2 per kilometre while a passenger in a bus contributes to 65 gm CO2 eruption per kilometre. This article is from Laokaoya website. Coaches, maritime and rail passengers emit the lowest amount of CO2 which is about 50 grams per passenger. Finally, an aeroplane traveller contributes to 370 km of CO2 per kilometre which is the highest.
根据柱状图,一辆私家车的乘客每公里可产生约130克二氧化碳,而公交车上的乘客每公里可产生65克二氧化碳。大客车,海运和铁路旅客的二氧化碳排放量最低,每位旅客约50克。最后,飞机旅客每公里可产生370公里的二氧化碳,这是最高的。
Based on the pie chart, the European Union spent the highest amount (52%) on the road transportation system while spent only 1% to 2% on ports, waterway airport intermodal and other transport systems. They spent 31% on the rail system and 10% on the public transportation system. This indicates the European Union spent the majority of the budget on public transportations.
根据饼状图,欧盟在道路运输系统上的支出最高(52%),而在港口,水路机场联运和其他运输系统上的支出仅为1%至2%。他们在铁路系统上花费了31%,在公共交通系统上花费了10%。这表明欧盟将大部分预算用于公共交通。


不同交通方式的二氧化碳排放和资金-雅思写作混合图-雅思小作文范文:等您坐沙发呢!