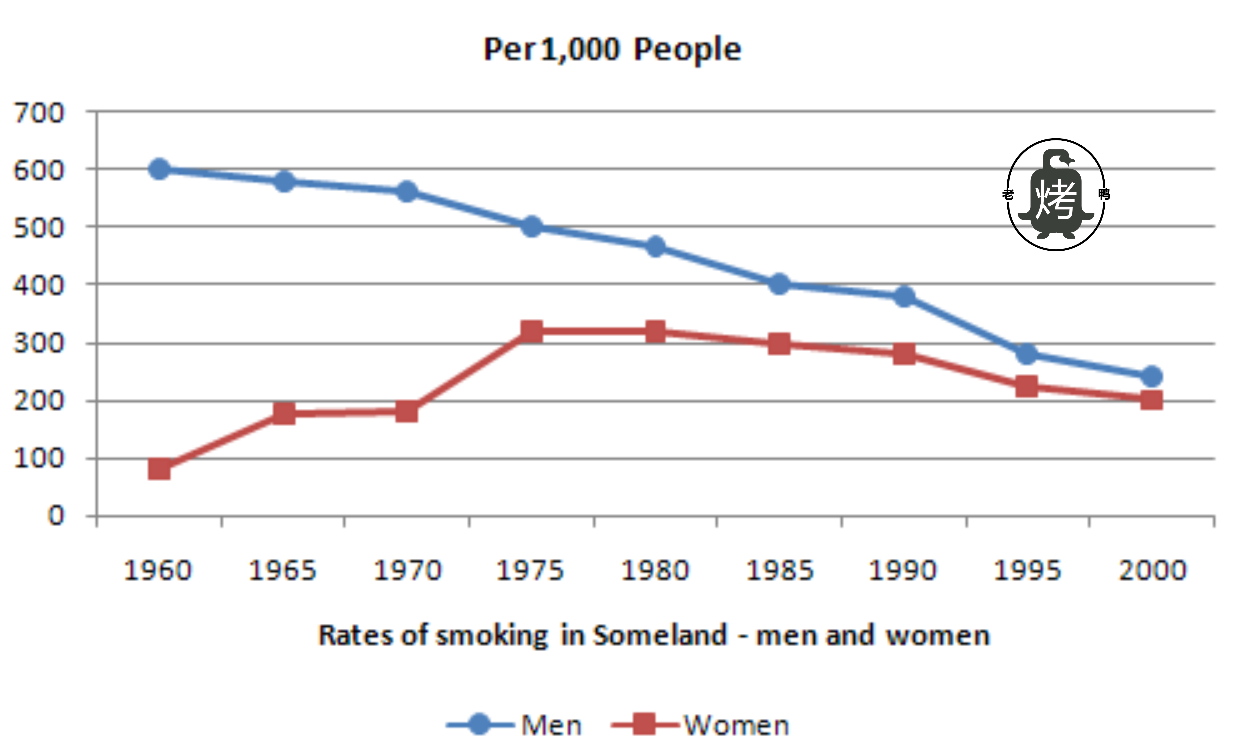
吸烟人员比例-雅思写作折线图(线状图)-雅思小作文范文 the rate of smoking per 1000 people
这篇雅思写作小作文给出了某地从1960年到2000年男性和女性抽烟者比例的变化。从图中我们可以看出,男性抽烟者的比例虽然一直在下降,但仍然比女性高。而女性抽烟者的比例则经历了先上升后下降的过程。老烤鸭小编收集了一篇相关的小作文范文以供大家参考。
雅思写作小作文题目
The graph below shows the rate of smoking per 1000 people in Someland from 1960 to 2000.
Summarise the information by selecting and reporting the main features, and make comparisons where relevant.

雅思写作小作文范文
The provided graph compares the male and female smokers from 1960 to 2000 in Someland. As is observed from the given presentation, over the 40 years, the number of male smokers dropped significantly while the number of female smokers increased.
给出的图表比较了某地区1960年至2000年的男性和女性的吸烟者。从展现出的图形中可以观察到,在40年里,男性吸烟者的数量显著下降,而女性吸烟者的数量则有所增加。
Initially, in 1960, 600 males out of 1000 smoked and the female smokers were less 100 in number in this year. Over the next 40 years, the number of male smokers decreased steadily and reached just over 200 out of 1000 people. On the contrary, though the number of female smokers was always fewer than the male smokers, their number progressed over the time. In 2000, the male and female smokers’ numbers got at around 200 in 1000 people.
最初,在1960年,每1000名男性中有600名抽烟;而这一年中,女性吸烟者还不到100名。在接下来的40年里,男性吸烟者的数量稳步下降,达到1000人中有200多人吸烟。相反,尽管女性吸烟者的数量总是少于男性吸烟者,但随着时间的流逝,女性吸烟者的数量不断增加。2000年,男女吸烟者的比例均达到1000人中约为200人吸烟。
In summary, male smokers were higher in number than female smokers from 1960 to 2000 but while the number of male smokers decreased steadily, female smoker’s number increased and in 2000, the percentage of male and female smokers got almost the same.
总之,从1960年到2000年,男性吸烟者的数量高于女性吸烟者。尽管男性吸烟者的数量稳步下降,女性吸烟者的数量却有所增加,并且在2000年,男性和女性吸烟者的比例几乎相同。
点击查看更多雅思写作小作文高分范文,快速提升写作成绩


