雅思写作小作文范文 雅思写作饼状图pie chart 美国居民花费
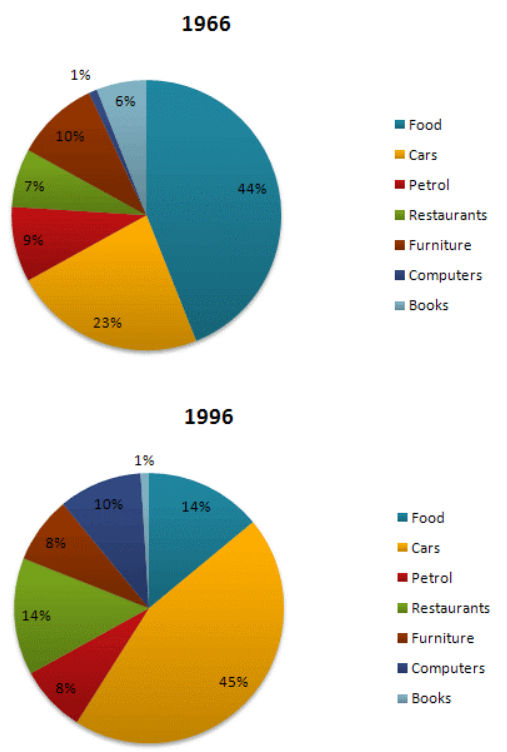
今天我们雅思写作小作文范文的文章来研究下饼状图pie chart。题目中的饼状图展示了1966年以及1996年美国居民在七种类别的商品上所花费的金钱比例。写作过程中,我们可以按照下降,不变,上升进行分类;也可以按照最大、最小值进行分类。老烤鸭小编搜集了一篇相关的高分范文,以供大家参考。
雅思写作小作文题目
The given pie charts compare the expenses in 7 different categories in 1966 and 1996 by American Citizens.
Summarise the information by selecting and reporting the main features, and make comparisons where relevant.

雅思写作小作文范文
The pie charts compare the expenditure of US residents in two different years in seven categories namely food, cars, petrol, restaurants, furniture, computers and books.
饼状图比较了美国居民在两个不同的年份里在7种类别的物品上所花的金钱比例。该7种类别的物品为:食物、汽车、汽油、餐厅、家具、电脑以及图书。
It is clear that the largest proportion of American citizens’ spending went on foods and cars. On the other hand, computers and books have the lowest percentage in the chart in 1966 and 1996 respectively. In 1966, 23% of American citizens’ expenditure went on cars. This article is from Laokaoya website. The percentage rose to nearly double at 45% in 1996. The proportion of spending on food fell from 44% in 1966 to only 14% in 1996.
很明显,绝大多数美国居民的花费用在食物和汽车之上。另一方面,在饼状图中电脑在1966年所占的消费比例最低,而图书则在1996年所占的消费比例最低。1966年,百分之二十三的美国民众花费用于汽车之上。这一比例在1996年几乎翻倍,达到百分之四十五。在食物上的消费比例则从1966年的百分之四十四讲到了1996年的百分之十四。
Expenditure on computers stood at only 1% in 1966 but reached 10% in 1996. The percentage of American citizens spending on restaurants had doubled from 7% in 1966 to 14% in 1996. Spending on books was highest in 1966, at 6%. By contrast, there was no significant change in the proportions of petrol and furniture over a period as a whole.
电脑方面的花费在1966年只占到百分之一,但在1996年则达到百分之十。美国居民在餐厅上的消费比例翻了一倍,从1966年的百分之七上涨到1996年的百分之十四。图书方面的花费在1966年最高,为百分之六。相比之下,汽油和家具方面的花费比例在该时间段里则没有太大的变化。
点击查看雅思写作小作文高分范文,快速提升写作成绩


