雅思写作小作文范文 雅思写作柱状图bar chart 监狱关押人数
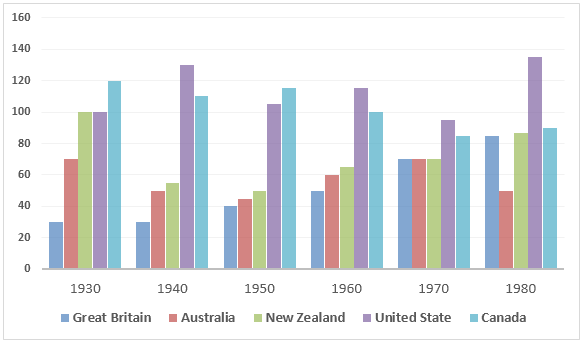
今天我们雅思写作大作文范文的文章来研究下柱状图bar chart。该图表显示了5个国家(大不列颠,澳大利亚,新西兰,美国,加拿大)在1930年到1980年之间被投入监狱的人数。需要注意的是图表中所显示的数据的单位为1千。千万不要弄错了。除此之外,图表给出的数据有些多,比较考验大家分组比较的能力。老烤鸭小编搜集了一篇相关的高分范文,以供大家参考。
雅思写作小作文题目
The table below shows the figures (in thousand) for imprisonment in five countries between 1930 and 1980.
Summarise the information by selecting and reporting the main features, and make comparisons where relevant.

雅思写作小作文范文
The table chart compares the numbers of prisoners from 1930 to 1980 in five different countries, namely Great Britain, Australia, New Zealand, the United States, and Canada. At a glance at the graph reveals that imprisonment figure in the USA and the UK climbed over the period and in Canada, Australia, New Zealand, it actually declined.
该表格比较了1930年到1980年五个不同国家囚徒的数量。五个国家为大不列颠,澳大利亚,新西兰,美国以及加拿大。一眼望去,该图表说明在这段时间里,美国和英国监狱里的人数有所上升,而加拿大、澳大利亚以及新西兰监狱里的人数事实上有所下降。
It is clearly seen that the United States had the highest number of inmates. Also, Britain had the lowest figure in 4 out of 6 years. This translation is from Laokaoya website. In 1930, the number of prisoners in the United States was the highest, with 120 thousand prisoners, then this number increased significantly to reach a peak of 140 thousand in 1980. By contrast, Britain had the lowest figure of prisoners until 1970, then the figure jumped suddenly to reach 90 thousand.
很明显可以看出来,美国囚犯的数量最多,而英国在这六年里有四年的囚犯数量最少。1930年,美国囚犯的数量最高,大约为十二万人。随后这一数字显著增长,在1980年的时候达到最高的十四万人。相比之下,英国囚犯数量直到1970年都是最低的,之后该数字突然上涨到了九万。
Canada had the highest number of imprisonment in 1930 and 1960 with nearly 140 thousand people each year. In 1970 the number of prisoners in Great Britain, New Zealand and Australia was the same, about 70 thousand people. In 1980, 50 thousands of people in New Zealand were put in prison which was the lowest figure in this year.
加拿大囚犯的数量在1930年和1960年最高,几乎达到每年十四万人。1970年,大不列颠、新西兰以及澳大利亚的囚犯数量相同,均为七万人左右。1980年,新西兰有五万人被投入监狱。该数字在这一年里是最低的。
点击查看雅思写作小作文高分范文,快速提升写作成绩


