雅思写作小作文范文 雅思写作混合图 前往澳大利亚的游客
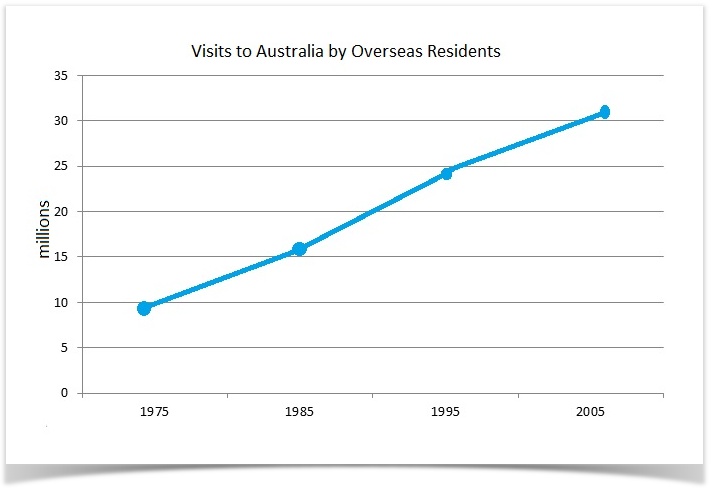
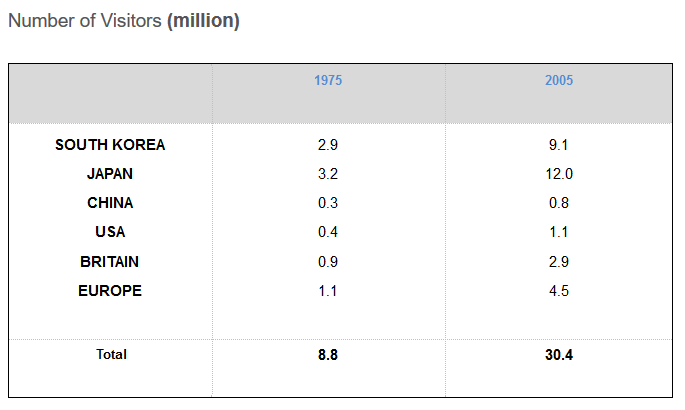
今天我们雅思写作小作文范文的文章来研究下混合图。该图表为折线图和表格的组合,其中折线图给出了从1975年到2005年前往澳大利亚的游客数量,而表格则展现了1975年和2005年这些游客的国家分布。第一张图比较好描述,第二张图的数据则要稍微多一些。老烤鸭小编搜集了一篇相关的高分范文,以供大家参考。
雅思写作小作文题目
The line graph below shows the number of annual visits to Australia by overseas residents. The table below gives information on the country of origin where the visitors came from.
Summarise the information by selecting and reporting the main features, and make comparisons where relevant.


雅思写作小作文范文
The given line graph illustrates the annual visits to Australia by foreigners in million from the year 1975 to 2005 while the table represents these visits from six different countries in both 1975 and 2005.
上面给出的折线图说明了从1975年到2005年每年前往澳大利亚的外国游客数量(以百万为单位计算),而表格则对1975年和2005年来自6个不同国家的游客数量进行了展示。
A staggering increase in the number of visits to Australia is noticeable. A large portion of this increase can be attributed to South Koreans and Japanese tourists as is evident in the table data.
可以注意到前往澳大利亚的游客数量有缓慢的增长。从表格中的数据来看,该增长的很大一部分可以归功于韩国和日本的游客。
An upward moving trend is clearly visible in the line graph that shows an increase in visits to Australia by foreigners as the number rose from 8.8 million in 1975 to 30.2 million in 2005, almost trebling in value in the period spanning from 1975 to 2000.
在折线图中可以明显看出向上移动的趋势。它展示了前往澳大利亚游览的外国游客数量的增长,数字从1975年的880万到达2005年的3020万。从1975年到2000年期间,几乎上涨了3倍。
This spike in numbers can be largely attributed to South Koreans and Japanese tourists as their tourism rose a whopping 15 million collectively. This translation is from Laokaoya website. This trend was not seen in the United States, China, or Britain as their tourists’ numbers who visited Australia did not increase significantly (1.1, 0.8 and 2.9 respectively in 2005). European tourism, however, also saw a rise in appetite towards Australia their tourism almost quadrupled from 1975 to 2005.
这一数字的增长很大程度上归功于韩国和日本的游客,他们的数量一共上涨了1500万。同样的趋势并没有在美国、中国或者英国看到。它们前往澳大利亚游览的游客数量没有大幅增长。2005年依然分别是110万,80万和290万。然而,欧洲游客对澳大利亚的喜爱也有上升。从1975年到2005年,它们的数字几乎翻了四倍。
点击查看雅思写作小作文高分范文,快速提升写作成绩


