雅思写作小作文范文 雅思写作柱状图bar chart 游戏销售量
今天我们雅思写作小作文范文的文章来研究下柱状图bar chart。这次图表的内容为四种游戏平台从2000年到2006年这7年间的销量。图中用不同的颜色来表示不同的游戏类型,共有28个数据。因为数据较多,相当考验大家分类对比的能力。老烤鸭小编搜集了一篇相应的考官范文,以供大家参考。
雅思写作小作文题目
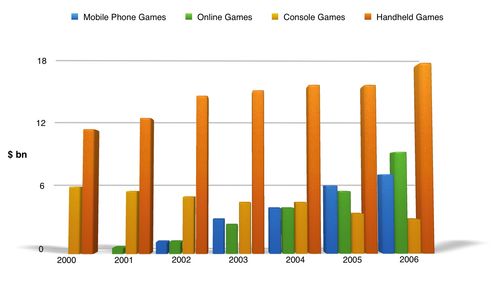
The bar graph shows the global sales (in billions of dollars) of different types of digital games between 2000 and 2006.
Summarise the information by selecting and reporting the main features, and make comparisons where relevant.

雅思写作小作文范文
The bar chart compares the turnover in dollars from sales of video games for four different platforms, namely mobile phones, online, consoles and handheld devices, from 2000 to 2006.
柱状图比较了从2000年到2006年四个不同平台视频游戏以美元计算的销量,即移动电话,互联网,控制台和手持装置。
It is clear that sales of games for three out of the four platforms rose each year, leading to a significant rise in total global turnover over the 7-year period. Sales figures for handheld games were at least twice as high as those for any other platform in almost every year.
很明显,四种平台中三种的游戏销量都逐年上升。导致七年间游戏的全球总销量有了极大的提升。几乎每年手持游戏的销售数字都是其他平台的两倍以上。
In 2000, worldwide sales of handheld games stood at around $11 billion, while console games earned just under $6 billion. No figures are given for mobile or online games in that year. Over the next 3 years, sales of handheld video games rose by about $4 billion, but the figure for consoles decreased by $2 billion. Mobile phone and online games started to become popular, with sales reaching around $3 billion in 2003.
2000年,手持游戏世界范围的销量为大约110亿美元,而控制台游戏才不到60亿美元。那一年移动和互联网游戏没有任何数据。在接下来的三年里,手持游戏的销量上升了大约40亿美元,但是控制台游戏的数据下降了20亿美元。手机游戏和互联网游戏开始变得流行起来,其销售数据在2003年达到大约30亿美元。
In 2006, sales of handheld, online and mobile games reached peaks of 17, 9 and 7 billion dollars respectively. By contrast, turnover from console games dropped to its lowest point, at around $2.5 billion.
2006年,手持游戏、互联网游戏和手机游戏的销售量分别达到170亿美元,90亿美元,以及70亿美元的最高点。相比之下,控制台游戏的销量降到了最低点,大约25亿美元。


